While serving as the architectural conservator for Historic Deerfield Inc. in Deerfield, Mass., I became proficient at dating structures via dendrochronology. In 2003, under the tutelage of Paul Krusic (at the time a dendrochronologist at the Tree-Ring Laboratory of the Columbia Climate School Lamont-Doherty Earth Observatory, based in Palisades, N.Y.), I learned the rudiments of dendrochronology as it pertains to the dating of historic structures (dendroarchaeology). Since then I’ve undertaken over 250 such studies of structures from the late-17th century to the late-19th century in all six New England states, as well as eastern New York state.
William Flynt
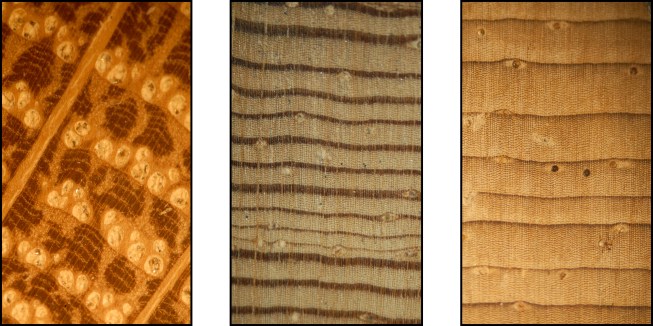
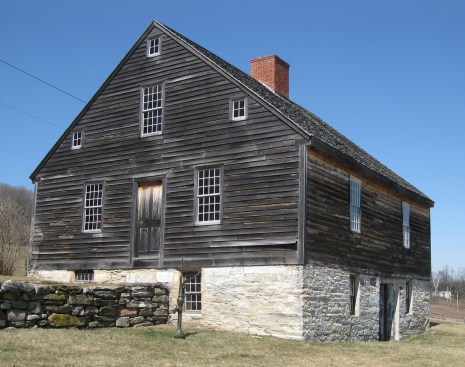
Sample growth rings of oak (left), pitch pine (middle) and white pine (right).
Dendrochronology, or the study of tree ring growth patterns, was initially developed in the 1920s by Andrew E. Douglass using long-lived ponderosa pines in the Southwest United States. An astronomer by training, Douglass was interested in historical sunspot activity and its relationship to earth’s climate. He surmised that by looking at yearly growth ring sequences in long-lived trees growing in an arid environment where moisture is key, he might be able to ascertain yearly variations in climate attributable to sunspot activity. To extend the tree ring database back past the age of living trees, samples were taken from ancient roof poles located in Pueblo ruins; these samples turned out to eventually overlap the living tree data. Besides fulfilling his research needs, Douglass’ work revealed the feasibility of dating archaeological structures. (In the December, 1929 issue of National Geographic, a lengthy article by Douglass titled “The Secret of the Southwest Solved by Talkative Tree Rings” details his pioneering work in this field.)
In the 1980s, the advent of computer programs to collate the data and compile dated master chronologies enabled unknown samples to be compared to known masters with a high degree of accuracy. Also, regions once considered too variable climatically to provide reliable results—for instance the Northeast, where I work—were now in play. With improved data technology, dendrochronology is now used as a mainstream research tool for analyzing and establishing construction-timber felling dates throughout the world.
Species. In the Northeast, I have the best results dating oak, hemlock, and pitch pine because there are a number of robust regional databases for these species, thanks to the work of dendrochronologists from the Lamont-Doherty Tree-Ring Laboratory, the Oxford Dendrochronology Laboratory, the Oxford Tree-Ring Laboratory, the University of Arizona Laboratory of Tree-Ring Research, and my work. Occasionally, I deal with white pine, spruce, and chestnut, though due to limited dated master availability and issues with climate sensitivity (seemingly in the case of white pine) and lack of old-growth living trees (in the case of chestnut), these species are more difficult to date. Spruce I tend to find in southern New England only if I’m studying a structure along the seacoast or near a major river valley where transport from regions farther north was enabled by waterways.
The true age of homes. “Historic” homes are generally not as old as people think. The hypothetical “This is my grandfather’s ax. My father replaced the head, I replaced the handle, my daughter added tape to the handle. Is it still my grandfather’s ax?” holds true for dating homes and other historic structures. It’s not uncommon for people to go through deed records and trace a property back to say, 1721. The family that owned the property may have built a structure in 1721, added on to it in 1750, and in 1800, ripped off the original portion and replaced it with a new section. So, is this home 300 years old? No.
Here’s another common scenario: A house built, say, in 1721, burns to the ground in 1740 and is replaced with a new house the following year. The family sells the property in 1780, and the deed records say the property was sold with the buildings “there on.” The family owned the property the whole time, but there’s no record that the house burned, so without careful study of the structure, the earlier date becomes associated with the present, later structure. If this research is put into print, it can become “fact” that is often repeated, further strengthening the erroneous information.
Prior to the 1980s, people researching historic homes did not have dendrochronology testing available as a research tool and had to rely on other, less sophisticated tools and methods to analyze a building’s construction history. As a result, I often have to inform clients their homes are not quite as old as they think. This is not to say that some projects don’t confirm a date that agrees with the existing research on the building, as occasionally they do align. Once in a great while, the dendrochronology results reveal that a building was built earlier than previous research indicated, but this is rare.
Sampling projects. When I enter a building, one of my first steps is to assess the structure and determine which timbers are most likely original to the structure and which retain a portion of the bark, or “waney” edge, a feature that must be present to establish with certainty the last year of growth. I’m not concerned about when the tree started growing, only the year it was felled.
In addition, there must be a sufficient number of rings in a sample to span several distinctive climactic variations that register as patterns of wide and narrow rings. Ideally, having 100 years of growth is best, but more often than not, samples will range from 60 to 100-plus years. Timbers with fewer than 50 growth rings cannot be used. For sampling, timber size isn’t always indicative of success. I’ve drilled into large summer beams that have produced mere 60-ring samples and smaller studs that have yielded 100- to 110-ring samples. Thus, selecting likely candidates for sampling can be somewhat hit-or-miss.
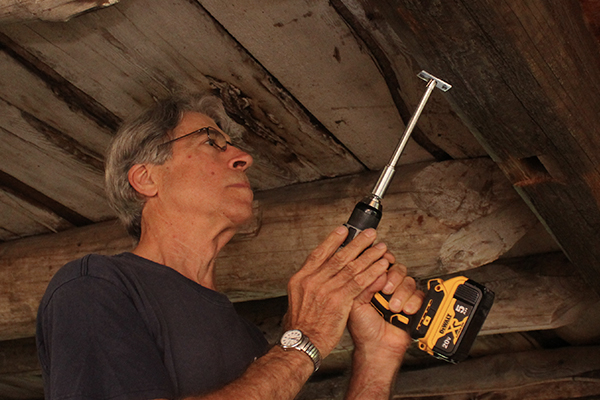
Coring. I take a core sample at each selected timber. Typically, 10 to 20 core samples are needed per project for comparison and to allow for some not dating, for one reason or another.
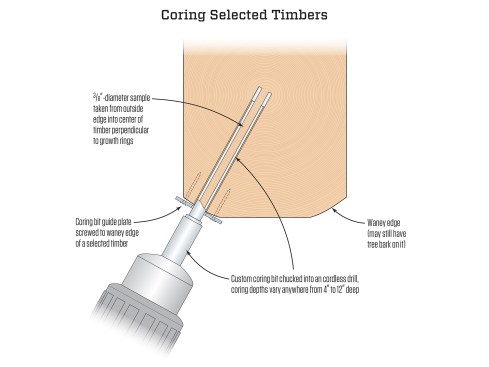
After attaching a guide plate to the waney edge of a selected timber, I use a custom coring bit chucked into a cordless drill to obtain a 3/8-inch-diameter sample. My goal is to drill from the outside edge into the center of the timber perpendicular to the growth rings. As the center of the tree is not always in the center of the timber, it’s not uncommon to drill a bit past the middle and a bit to one side or the other (which yields the semicircular growth rings shown in pitch pine sample below). This does not affect the results.
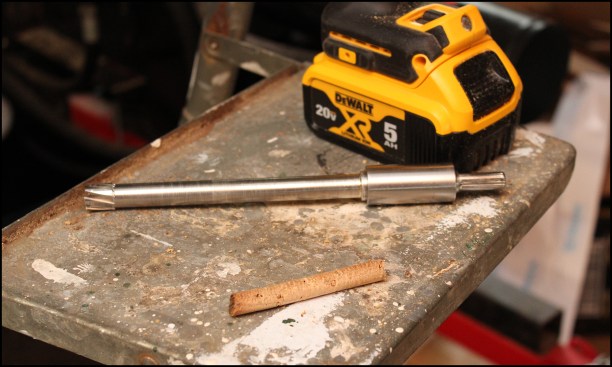
The custom coring bit doesn’t readily expel sawdust, so I work slowly and repeatedly pull out and clear the drill bit flutes while coring. If the core stays intact throughout the drilling process, it is removed from the timber with the use of a thin metal rod with a sharp “L” tip that is slipped down the side of the core and twisted to cut through the base of the sample, which can then be removed. Should the sample break during coring, I simply separate the coring bit from the drive adapter and remove the cored sample from the drill tube. Coring samples run anywhere from 4 to 8 inches in length (or longer, in rare instances). When cores break during sampling, it is often possible to accurately reglue clean breaks without losing rings.
I label all the samples and enter them into a log book that notes the position of each sampled timber within the structure, its species, whether it has wane, and any other information pertinent to the sample.
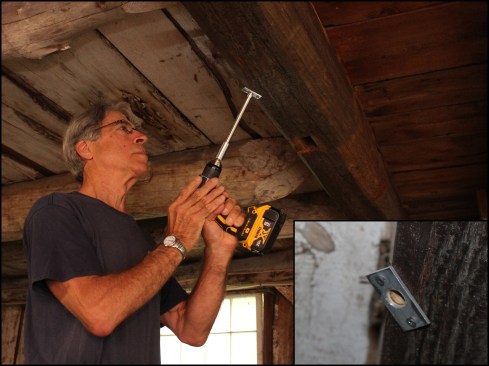
The author attaches a guide plate to the “waney edge” of a timber (inset photo), then takes a sample at each selected timber using a special coring bit.
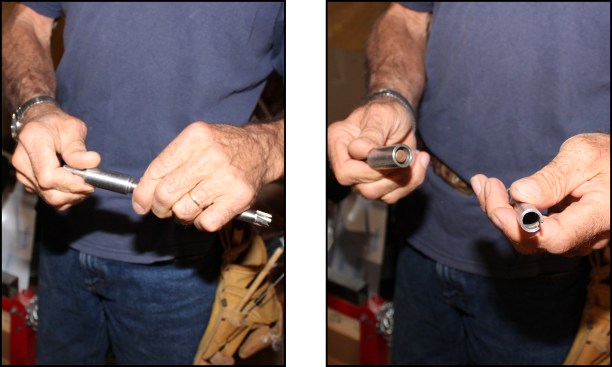
Should the sample break during coring, the custom coring bit (left) separates from the drive adapter (right) to …
… allow the core sample to be removed from the drill tube.
Prepping samples. Back at home, I glue the core samples into custom wood mounts, longitudinally, as if you were looking down the tree in section view. The mounted samples are numbered (corresponding to the log book information) and then sanded down using successively finer grit paper with a benchtop belt sander (150 grit) and hand sanding (220, 400, 600 grit) to create a mirror-smooth finish.
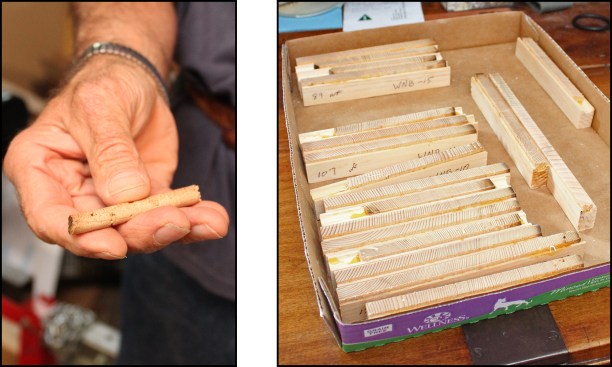
Core samples (left) are glued longitudinally into custom wood mounts and are sanded down using successively finer grit paper to a mirror-smooth finish. Here, recently cored spruce samples from a barn in Whately, Mass., are ready to be measured (right).
William Flynt
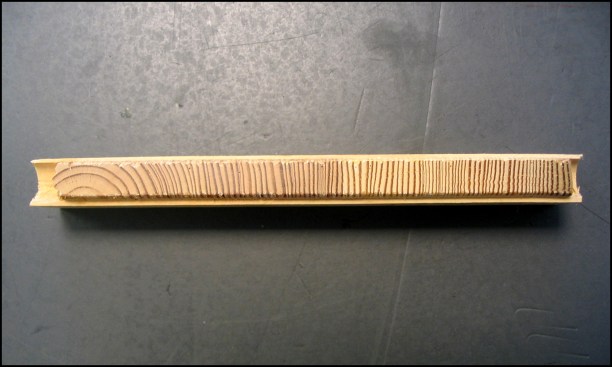
This sample of pitch pine, which is a northern hard pine similar to southern yellow pine, displays contrasting growth rings.
Measuring tree ring growth. I view all the samples using a low-power stereo zoom binocular microscope fitted with crosshairs in one eyepiece to ascertain and mark the number of rings per sample. This is followed by a visual review of all samples to determine if site-specific growth patterns can be picked out. Each sample is then placed under the microscope on a sliding stage calibrated to read to the nearest micron (.001mm), tied electronically to a computer. Measuring begins at the outer, or last year of growth ring, established as 1000, and proceeds to the center of the sample or first year of measure (the waney edge is assigned the number 1000, the second-to-last ring is 999, and so on, down until the earliest ring in the sample is measured). Working with the measuring program J2X, I measure the width of each ring by moving the sliding stage with its rotating gear system and enter the width into a J2X computer file by clicking a start-stop button, similar to a mouse. Depending on the number of samples and the ring counts in them, measuring can take a couple of hours to more than a day.
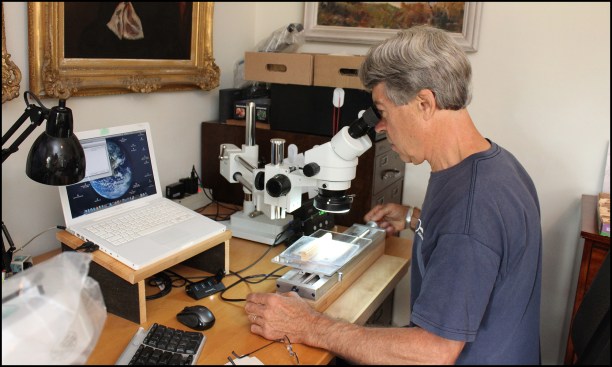
Each sample is placed under a stereo zoom binocular microscope on a sliding stage with a micro-adjustment knob calibrated to read to the nearest micron.
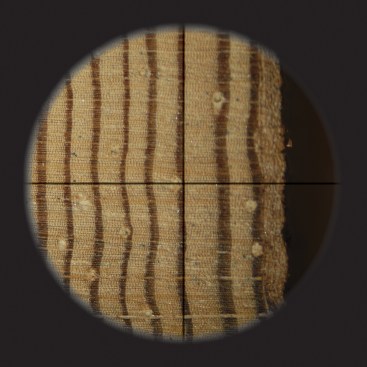
Here, a pitch pine sample is viewed under a microscope fitted with crosshairs in one eyepiece; the waney edge is on the right.
Analysis. Now comes the interesting part—for me anyway. With the raw data in hand and using dendrochronology-specific software, I can compare the samples from each site to determine if all were cut more or less at the same time or within the span of several years or more. This creates what is known as a floating, or undated but aligned, chronology. The samples are also compared against one or more dated regional master chronologies of the same species to determine the exact year or years when the samples in question were felled. As strong samples are uncovered, they are added to a fledgling site master, and the raw data is run against the site master to see if additional samples align.
William Flynt
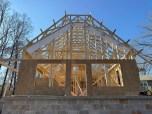
Sample Project: The Ephraim Fisher House, Orwell, Vt.
Example. Analysis can be complex and difficult to explain in a short article. To get a sense of what the results of a dendroarchaeology study look like, see Sample Project: The Ephraim Fisher House, Orwell, Vt. The study shown (see photo, above) was essentially a dendrochronological “home run”—because of how well all samples aligned among themselves as well as against dated masters—and was thus chosen for illustrative purposes. Not all studies are successful, though by my estimates, success is achieved approximately 85% of the time.
Photos by William Flynt and Tim Healey. Illustration by Tim Healey.