For this month’s column I’ve created the first part of an Excel-based system — a budgeting planner and break-even calculator that you can use to take some of the pain out of the yearly exercise of creating your jobs budget. Later, I’ll add a way to track your actual results against the budget you set up.
To download it, go to the library in the Business Technology forum at jlconline.com. Save the workbook to a safe spot on your hard drive and then make copies for your working data. If you fill in everything you can and save the workbook as an Excel template (.xltx), the bulk of the information will already be in place each time you open it. I used Excel 2007 for Windows to create the workbook. It can be modified to work on earlier versions of Excel or other spreadsheets like Google or Excel for Mac — but for everything to function smoothly right out of the box, you’ll need Excel 2007 or 2010 for Windows. There’s a complete set of instructions on the first worksheet, formatted for printing out, so there’s no need to repeat them here.
I’ve seen similar software tools created for production builders, but those don’t take into account the wide variety of work the typical JLC reader might encounter. With this workbook, you can determine your break-even volume for the year, by first dialing in your fixed overhead and then creating a mix of the five typical income streams a small-volume contractor might have: remodeling, repair/handyman, new homes, commercial, and “other” — things like design-only jobs or jobs where you only provide project management. Once you’ve entered your data, the spreadsheet uses your historical mix of work as a starting point for where you want to go in the future.
You can adjust this workbook to fit your business or draw on the Excel techniques I used to create your own workbook. Let’s take a look at some sample worksheets.
Setup
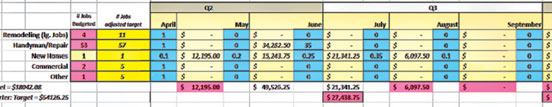
The first worksheet is where you fill out your company information, but it’s also a summary tool you can use “at a glance” after you’ve completed the other worksheets. Table C, Historical Revenue and Contribution Margin Summary, compiles the five types of income and calculates the relative percentage of each based on historical records, along with the gross profit (GP) and contribution margin (CM) percentages and dollars. ")
Note, for example, that handyman jobs accounted for 17 percent of the revenue but 23 percent of the contribution margin necessary to keep this company’s doors open. Conversely, new homes (this company built one last year) brought in 30 percent of the gross revenue but generated only 21 percent of the contribution margin. The business might be better off forgetting about new homes and just concentrating on its handyman service and larger remodeling projects. If you were the owner, you could use the spreadsheet to examine different scenarios — for instance, you could budget no new homes for the following year and see how many more handyman jobs would be necessary to make up the difference in contribution margin.
Identifying high overhead jobs. This table also quickly shows you the average selling price (ASP) of each type of work completed in the prior period, and the resulting gross profit and contribution margin from each. The difference between the GP and the CM represents the variable expenses associated with each type of work — supervision, sales commissions, and so forth. For example, the difference between GP and CM for large remodeling jobs is 15 percent (41 percent GP – 26 percent CM), while for commercial work it’s only 7 percent (35 percent GP – 28 percent CM). That means that generating a dollar from remodeling work required more company resources than generating a dollar from commercial work.
Why? Commercial work is typically a cut-and-dried low-bid scenario, executed by managing subcontractors. There is much less “salesmanship” and supervision required. So if you’re already shorthanded, you might conclude that doing more commercial work in the coming year is the best way to cover your fixed overhead without having to commit more resources. This conclusion is by no means definitive, but analyzing the numbers at least gives you some facts to base your decisions on, rather than going by opinion or emotion.