2013 Cost vs. Value Report
Lower costs and stabilizing house prices bump the cost-value ratio up a notch
6 MIN READ
Cost-recouped percentages were up for all 35 projects in the survey, a complete turnaround from the 2011–12 report, when percentages dropped in all but three projects, some precipitously.
The biggest gainers this year were mostly replacement projects, which have always outperformed discretionary remodeling projects, more so in recent years as the economic recession brought price to the forefront for homeowners making remodeling decisions.
For the third year running, lower construction costs had a strong influence on the improved market picture, although stabilizing resale values also played an important role. (The cost-value ratio expresses resale value as a percentage of construction cost. When cost and value are closer to each other, the ratio is higher; as they diverge, the ratio gets lower.) Construction costs had risen rapidly between 2005 and 2007, then at a diminishing rate through the early part of the recent recession, while resale value remained fairly stable (see Cost vs. Value 10-Year Trend). When costs finally dropped in 2010–11, it was by a whopping 10.4%, but resale values slid even more (15.8%), pushing cost and value further apart and driving the ratio down.
Costs stabilized in 2011–12, decreasing just 1.9%, but once again a larger downward slide in average value (5.6%) pushed the cost-value ratio lower. This year, that trend reversed itself as another big drop (6.0%) in construction costs met up with a modest decline (1.4%) in value.
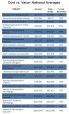
As is always the case, some markets performed better than others. Once again, the best-performing group of cities is in the Pacific region (see “Cost Recouped by Region”), where both construction costs and resale values, though lower than last year, were the highest in the country. Next in line are the three southern regions — West South Central, South Atlantic, and East South Central — which had the lowest construction costs in the nation. All four of these regions performed better than the national average.
Of the five remaining regions, all of which performed below the national average, the West North Central region was most improved. Significantly lower costs and increased resale values in these regions combined to produce a cost-value ratio that is 4.3 points higher than last year.
High-Value Projects
Historically, exterior replacement projects have always achieved a higher overall cost-value ratio than discretionary projects, and that is once again the case. The average cost-value ratio of all 14 replacement projects in our report is 67.6%, almost 8 points higher than that of the 21 discretionary projects, which together average 59.7% (see “Replacement vs. Remodeling”). And seven of the top 10 projects in this year’s report are siding-, window-, and entry door- or garage door-replacement projects that collectively generate an above-average cost-value ratio of 74.6%.
Some of these projects displayed extremely high value. One way to measure that is to compare a project’s cost-value ratio with the historical high average, which peaked in 2005 at 86.7%. By this measure, too, replacement projects are clustered at the top, with many achieving a cost-value ratio of 90% or higher in a large number of cities (see “High-Value Projects” ). One reason for this is their relatively low cost: most replacement projects are priced at less than $20,000; four at less than $5,000. And, given the emphasis on resale value built into the Cost vs. Value survey, the dramatic improvement to curb appeal that most replacement projects produce is a strong factor in raising the perceived value of a home in the eyes of prospective buyers.
Minor Kitchen Remodel (75.4%) is also once again in the top 10, although given its scope of work (replacing cabinets fronts, countertops, cabinet hardware, and appliances with no structural or system modifications) and relatively low cost — it averages $18,527 nationally — it could easily be classified as a replacement project. Not so, however, for the other two projects in the top 10, Attic Bedroom and Basement Remodel, both of which carry higher-than-average cost-value ratios (72.9% and 70.3%, respectively). The higher average costs for these projects — $47,919 for the Attic Bedroom, and $61,303 for the Basement Remodel — are still the least expensive way for homeowners to add living space.
High-Value Cities
While averaging is an important tool when drawing broad conclusions, it also can obscure the fact that some projects perform much better in specific markets. Though city data samples vary in size, counting the number of high-value projects can help to identify how well a particular market is performing.
This year in almost half of the cities surveyed, at least one project exceeded the historical high (86.7%), and 16 cities recorded five or more such projects (see “High-Value Cities”). In fact, in many cases, high-value cities supported projects that scored well over 90% in cost recouped. For example, Deck Addition achieved a cost-value ratio of more than 100% in eight of the 81 cities surveyed, and more than 86.7% in nine others.
Note, however, that this phenomenon has more to do with the particular market than with the project. This is perhaps more true today than in the past because of the slow recovery of housing prices. Projects that exceed 100% return are less common than they were five to seven years ago.
Often, the phenomenon is localized within markets where house values are rapidly appreciating. (We saw this in 2005, when house prices were rising so fast that almost any investment a homeowner made in remodeling would more than pay for itself at resale.) In other cases, buyer expectations for a particular neighborhood play an important role. For example, in a neighborhood where most houses have two-and-a-half baths, adding a bathroom to a house with one-and-a-half baths brings that house up to “standard.” This makes it more likely to meet buyer expectations, and can result in a higher sales price or a shorter time on the market.
Looking Ahead
The upturn in this year’s Cost vs. Value Report is an encouraging sign that the remodeling industry may have turned the corner. It squares with the Harvard Joint Center for Housing Studies’ LIRA (Leading Indicator of Remodeling Activity) and with our own RRI (Residential Remodeling Index), both of which forecast a strong recovery for remodeling in 2013. Anecdotal evidence also supports these forecasts, with many remodelers reporting more qualified leads, larger projects, and a shorter sales cycle.
That said, supply still outstrips demand in many areas, and recession-induced price sensitivity continues to promote strong competition. Combined with the tempering effects of political and economic uncertainty on consumer spending decisions, most contractors will likely proceed cautiously through the early part of the year.
But if house prices continue to rise and the economic recovery continues, by mid-year there may well be reason to celebrate. Click here to view the 2013 data.
—Sal Alfano, editorial director, REMODELING.
Research Team
- REALTOR® magazine and the National Association of REALTORS surveyed its member sales agents, brokers, and appraisers to obtain estimates of resale value. Nearly 3,900 responded.
- The Farnsworth Group, an online market research company, programmed and hosted the Remodeling Cost vs. Value Web-based survey, collected and compiled the data between August and October, and provided consulting.
- RemodelMax, a publisher of estimating tools for remodelers, used Clear Estimates remodeling software to generate cost estimates for all 35 projects in 81 cities.