Last month, I introduced the concept of working “by the numbers” — meaning that you plan your annual income requirements in advance, then attempt to translate your goal into project sales, starts, and completions. You always work toward the plan, making adjustments along the way as necessary. I also made some distinctions between the kind of accounting your CPA does and “management” accounting and reporting — using the numbers your business generates to make successful operating decisions.
This process is the beginning of “strategic budgeting.” By establishing your goals for the year early on, you are building a road map for success — not just for the coming year, but for as long as you operate your business. Consistent strategic budgeting can make the difference between being able to retire with money in the bank and limping into your golden years. And it’s never too late to start. Whether you have four years in front of you or 40, this process will improve both your business and your lifestyle.
This month, I’ll look at “break-even volume,” which is the bare-minimum volume of work that you need to complete (and get paid for) in order to keep your doors open. This may be a little boring, but bear with me.
Required Information
To calculate break-even volume, you need several key pieces of information, including the following:
The basic financial/budgeting model for your business. By this I mean the percentage of revenue budgeted for the various expense categories (such as your office overhead or project supervision). As we saw last month, these numbers are somewhat different for builders and remodelers.
Projected average selling price for projects in the various categories you build or remodel.
Projected average gross-profit percentage for the budget period (see last month’s column).
Projected fixed operating expenses for the budget period.
Projected average variable operating expenses for the budget period.
Projected average construction indirect expenses for the budget period.
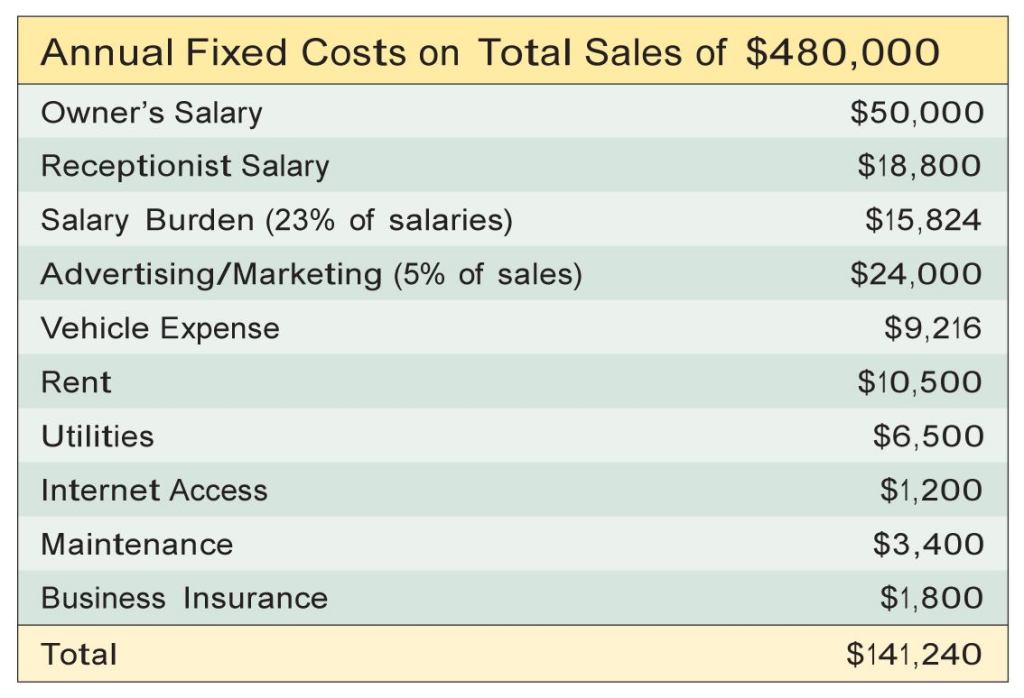
Fixed Expenses
Fixed expenses occur whether or not you build anything — they are the cost of keeping your doors open, and meeting them is what break-even is all about (see Figure 1). They include:

If you’re a small remodeler, your fixed expenses might look like this. These are expenses that occur whether or not you’re doing a project — such as office overhead, marketing costs, and nonconstruction salaries (including yours). The total of these costs is the “nut” you have to overcome simply to keep your doors open.
All salaries and hourly wages not directly related to job costs, such as those paid your receptionist, estimator, and CAD operator, as well as your own salary.
The labor burden on those positions — Social Security, unemployment insurance, and any benefits you pay as an employer.
Vehicle expenses. This is a tricky category. Include only vehicle expenses that are truly fixed for the budget period — items that don’t change month to month and don’t go away if you subtract people or build fewer jobs, such as lease and loan payments, regular maintenance, and the like. (Treat vehicle allowances and mileage reimbursements for salespeople and superintendents separately.)
Advertising and marketing expenses. Even if you don’t actually spend a dime on advertising, budget something. (Use 5 percent of your sales if you’re a remodeler and 2 percent if you’re a home builder.)
Business insurance, including insurance on your building and its contents, general liability, and — if you’re a design-builder — errors and omissions insurance. (Be careful here, as some types of insurance are calculated against your gross sales or gross wages for the period.)
Office expenses: phone, utilities (for the office, not your job sites), facility maintenance (snowplowing, cleaning), repairs, and so forth.
Average Variable Expenses
Unlike fixed expenses, which occur no matter what, variable expenses occur only when you’re building or remodeling something. If you do more work, you incur more variable expenses, including:
Sales commissions
Supervision
Job-site costs
Warranty costs
Construction loan interest
Closing costs
For calculating your break-even volume, take an average of these expenses from whatever time frame best represents reality. If you normally average 10 jobs per year but saw a slowdown last year, take the earlier average.
What about supervision? Last month, I put supervision in the category of “construction indirect” expenses — costs that are necessary to get the job done but not actually part of the labor and material installed in the job. Unless you’re subcontracting your supervision, you can’t hire a portion of a person, and if you’re using lead carpenters, only a portion of their salary or wages is supervisory. Don’t confuse this with how you bill the time to clients: For budgeting, it’s an issue of your overhead cost for the period. To be safe, if you expect your lead carpenters to spend half their time banging nails, then for purposes of budgeting include that half of their wages and burden as a fixed operating expense and the other half as supervision, a variable expense.
Contribution Margin
The first step in determining your break-even point is to calculate your average project’s “contribution margin” — the average chunk of change that each completed project contributes toward covering your fixed expenses for the period.
Contribution margins will be unique for each person reading this. Your contribution margin depends on the type of job you do, your selling price, and your gross-profit margin. It’s calculated on the basis of an average project.
In the example above in Figure 2, which represents a remodeling company, the fixed costs for the year are $141,240, or $11,770 per month — just shy of 30 percent of annual sales. The average project is an $80,000 job that contributes $25,256 toward keeping the doors open. The gross-profit margin is 40 percent, though the contribution margin is much less — only 31.6 percent. That’s because we also have to pay several cost categories out of the gross profit for each job. The salesperson needs to be paid, we need to allocate some money toward supervision, and we have to account for the warranty and job-site costs we know we will incur.

The average contribution margin for each job is its average gross profit (the selling price minus direct job costs) minus average variable costs like sales commissions and construction loan interest. Dividing your total fixed overhead by the average contribution margin will yield your break-even volume — the number of average projects you need to complete and collect for during the period.
In this case, we simply divide the fixed annual expenses of $141,240 by the average job contribution of $25,256 and come up with an annual break-even volume of 5.6, or conservatively, six projects for the year — one every two months. Remember that you have to complete and collect for those six average projects, not just sell them. Assuming that nothing else in our overhead model changes, you could also interpret this result as meaning that you need one $40,000 project per month or two $240,000 ones per year — and so on.
Break-Even Dollars vs. Number of Projects
This per-project calculation is a good yardstick if all of your jobs are similar, as they might be if you only do room additions, or only build new homes. But what happens if you handle projects ranging from small handyman jobs to whole houses, as many of you do? In that case you need to think in terms of contribution dollars, not just number of projects.
If you’re a specialty or replacement contractor — if you do decks, roofing, siding, replacement windows, basement finishing, and the like — you can think in terms of installed square footage or installed units per month or quarter. If a square of vinyl siding installed had an average selling price of $250, a gross-profit percentage of 40 percent, and a contribution margin of 31.6 percent, each installed square would contribute $79 toward your monthly “nut” of $11,770 and you would need to install and collect for 149 squares per month to keep the doors open.
Note that your break-even calculations should be based on your own history whenever possible. Smaller jobs will probably have lower site expenses (you may not need a dumpster or a Porta-John, for example.)
Break-Even Analysis
If you don’t like the break-even numbers you’re coming up with, try some calculations using a higher gross-profit margin or lower fixed costs to see what happens if you could increase efficiency or were able to raise prices. As I mentioned last month, it’s gross profit that drives business, not your bottom line. If you still don’t believe me, lower your GP a few points and run the break-even calculations again; you’ll be surprised how much harder you’ll need to work to keep your doors open.
In this month’s example, if we make our gross-profit margin 30 percent rather than 40 percent, our contribution margin drops to only 21.6 percent, which means that we would have to complete and collect for more than eight average projects instead of six (Figure 3).

Look what happens if you lower your gross profit from 40 percent (as in Figure 2) to 30 percent. The contribution margin follows suit, and the break-even volume jumps to more than eight projects for the period instead of the original six. Use the break-even calculator uploaded to the Business Technology forum at jlconline.com to do your own what-if calculations.
This break-even analysis is something you should be doing on a regular basis. It’s the best way to ensure you’re selling enough work at a high enough margin to cover your annual expenses and still earn the bottom-line profit you need to reach your financial goals. To help, I’ve uploaded an Excel break-even calculator to the library of the Business Technology forum at jlconline.com.
JLC contributing editor Joe Stoddard moderates the Business Technology forum at jlconline.com.