by Paul Eldrenkamp
Increasingly, we contractors are getting involved in projects early in the design phase, through either design-build or negotiated contracts. When this is the case, one of our key roles is to provide realistic, accountable budget feedback to help guide design decisions. Such feedback is, in fact, a prime benefit to the client of choosing design-build or negotiated contract over competitive bid.
Yet how often do we find ourselves in the following extremely uncomfortable position: After having provided one budget range for the initial schematics, we discover two or three design iterations later that we’re far beyond the original budget. Meanwhile, the client is sitting there across the table from us, saying, “But how can it cost that much all of a sudden? We haven’t added anything!”
No Design, No Price
No matter how many times you’re called on to do it, it’s hard to take schematic drawings that are light on detail (they’re frequently just hand-sketched floor plans with no elevations) and imagine or remember all the features you need to include to put together a realistic budget. I often tell a client or an architect that “to price a project is to design it” — meaning that I can’t really put a solid number on any project without filling in all the details and selecting all the products and finishes.
But it’s impractical and expensive to wait until all that design and specification work is completed before starting to provide budget feedback. The trick is to carefully document the initial important assumptions that go into the first budget, and then to track from design iteration to design iteration how those assumptions evolve.
I document these scope assumptions in an outline format with only a few — if any — line-item dollar figures attached. I think it’s misleading to provide detailed budgets too early in a design process: It fosters a premature, even false, sense of budget precision and contractor control over client decisions. I’m much more comfortable providing lump-sum ranges for various plan options — plus or minus 20 percent, for example, depending on how far along the drawings are — with maybe a few major cost drivers broken out as subranges.
Using a Cost Grid
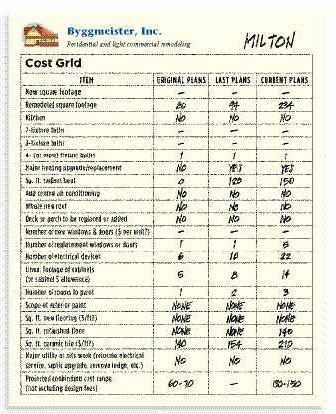
The format we use is a grid that compares important quantifiable project data in different stages of design development (see examples on pages 2 and 3).
Keep in mind that you can put whatever cost drivers are most useful to you in the first column; you don’t have to use the same categories I use. And your list, like mine, will probably change over time.
The blank rows toward the bottom can be filled in for project-specific items as needed. You can leave the “Projected nonbinding cost range” cells at the bottom blank — or delete them altogether — and still have a useful document. Likewise, you can either spell out the unit-cost assumptions for some items (like cost per square foot of tile or average cost per window) or just look at quantities, depending on what’s most useful.
But keep in mind that it can be helpful to document certain items from early on: An initial assumption of $400 windows that gives way to an ultimate choice of $800 windows can mean a doubling of line-item cost with no apparent scope increase.
Spotting Unfunded Expectations
The grid serves several purposes. First, it can be used to verify that we’re envisioning the correct scope from the beginning. If the client is assuming that the project includes painting and roofing the whole house — not just the addition — but the contractor is assuming otherwise, the grid will make clear early on that there’s an “unfunded expectation” — a disconnect between client wishes and contractor estimates.
You can also use the grid to make large-scale design decisions early in the process, such as, “Should the master suite go over the garage or over the family room?”
Do the analysis, see how the cost-driver columns compare, and make at least an initial decision based on that. You’ll get a rough idea of the relative costs of various possibilities by doing these comparisons, without having to go to your subs with requests for multiple quotes based on sketchy plans (something our subs tolerate at best but sometimes flat-out refuse to do, for good reason).
The grid helps a client (indeed, the whole project team) see “project creep” in action, in a quantifiable format. Project creep is the apparently inevitable tendency of a job to grow in both subtle and obvious ways during the design phase. It’s particularly insidious because it’s often not recognized or acknowledged by the client. For that matter, project creep is often not recognized by the architect or contractor, either, until it’s too late. This grid keeps everyone apprised of the degree to which this phenomenon may be happening on a given project.
The author’s cost grid contains no costs — only important quantifiable line items that drive costs. By tracking the remodeling design process through its iterations, both contractor and customer can monitor cost fluctuations. Comparing “remodeled square footage” with the cost range leaves no doubt about how the clients’ changing program will affect the estimate.
Most important, the cost-tracking grid can help take the apparent mystery out of price increases. Everyone can see the evolution from column to column. And it’s easy and fast to fill in — you don’t have to price anything out or get any quotes. You just fill in the data and take it to the next meeting.
Building Credibility
I recently had a project that underwent a significant floor-plan rearrangement in the middle of the design phase. The client’s perception — and mine, too, I have to admit — was that it was just that: a rearrangement. We expected the cost to stay basically the same.
Here, the initial wish list may have proved to be beyond the budget. This is reflected in the lines that show how remodeled square footage increased slightly while new square footage decreased.
But then the architect filled in the grid, and we realized there had been some significant but not-so-obvious scope increases. Because many of the quantities in the current-plans column were 15 percent to 20 percent higher than those in the previous-plans column, I was able to anticipate that the current project would probably cost 15 percent to 20 percent more. Better still, the homeowner was able to anticipate the increase, also — he was right there doing the math with me. He didn’t like it, but he understood and knew he couldn’t argue with the numbers. He was prepared for what would be coming down the road a month or two later, when the revised pricing was complete.
If you’re doing design-build or negotiated contract, the whole relationship is founded on your credibility. Unexpected and — from the client’s perspective — unintuitive budget increases can lose you an awful lot of that credibility very quickly. Thoughtful and disciplined use of a grid like the one described here will not only help you avoid such a loss, it will further enhance the credibility you already have.
is owner of Byggmeister Inc. in Newton, Mass.