Our remodeling company has been using lead sheets — simple printed forms on which we record information about potential clients who call our office — for several years now. We described the process in a previous Business column (“Save Time With a Lead Sheet,” 8/07); here, I’ll explain how we use the data we gather to better focus our sales efforts on those clients and projects that best suit our company.
At the initial call, we fill in the lead sheet, then store it in a binder. Once every quarter, I enter the data from the lead sheets into a spreadsheet that has been set up to produce a number of graphs. The nice thing about a graph is that you can look at it and know immediately whether the trend is up, down, or steady. If we looked only at raw numbers, we might not see the larger trends.
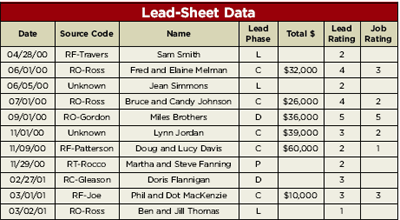
Coding the Leads
One key piece of information we collect during the initial phone call is the source of the lead: Who told the potential customer about our company? Not only do we want to know where the leads came from for jobs we did get; we also want to track this data for jobs we didn’t get.
To record the source, we use a two-letter code that starts with an R (for referral): RF if one of our friends or family members made the referral, RA if the referrer is an architect, RT for a trade subcontractor, RC for a current client, RP for a past client, and RO for any other source. If the potential client is a repeat client, we use RR.
We also add the name of the person who made the referral; if it’s our friend Joe Patterson, for instance, we code the lead “RF-Patterson.”
Although most of our clients are referred to us, we do get leads from other sources: job-site signs, newsletters, mailings, our Web site. We have codes for all these things, but what the numbers tell us is that they are not good sources of business; they may bring in some leads, but rarely result in paid work.
Following the lead. Every project starts out as a lead, which we indicate with the letter L. But if the lead develops, we change the code as the job goes through its phases. If we meet with the potential customer and decide we want to work with them, we change the letter to a P. When potential clients sign a contract for us to design the project and develop specs and an estimate, the letter becomes a D; and when they sign the construction contract, it becomes a C.
Simple ratings. We rate leads on a scale of 1 to 5. A lead who seems unlikely to become a client is a 1. A lead who seems very likely to become a client is a 5. We also grade our projects after they’re done. If the project was neither profitable nor particularly attractive, it’s a 1. If it was either profitable or nice-looking, we give it a 3. Projects that are both profitable and good-looking score a 5.
So why do we record all this information? To begin with, it’s not much trouble and it’s very useful. Here’s one example: Say we analyze the data and find out that in the last five years our friend Joe referred 10 different people to us. That’s good to know — maybe we should do something nice for Joe. On the other hand, what if none of Joe’s referrals progressed past the lead stage, or those that did became problem clients? That’s good to know, too; maybe we should proceed cautiously with any referrals we get from Joe — or even avoid them altogether.
Leads by Year
Now that we have several years of data, there’s enough information to provide meaningful feedback on how our lead numbers and sources have changed over time. Our “Leads by Year” graph (below) provides a year-to-year view of how our leads migrate through the sales process and how many ultimately convert to job contracts. According to this graph, we sign one construction contract for every three to four leads. Because that ratio has held true over time, it puts us in a good position to know whether we are generating enough leads to provide our desired volume of work.
The graph also shows that we sign about two design contracts for every construction contract. This helps us forecast the amount of design work we’re likely to do in the coming year.
Leads by month. Many of our graphs validate trends that we already suspected, but sometimes they surprise us. Our “Leads by Month” graph is a good example (below). We expected to find that January and September were our biggest lead months — January because homeowners have just finished with the holidays, and September because the kids have returned to school. But seven years of lead data suggests that homeowners take a while to recover from the holidays and summer vacation. Our peak months are actually March and November — two months later than we expected.
To maintain an even flow of work throughout the year, we may need to increase our efforts to generate leads during certain months. This graph helps us decide which months to focus on.
Back to the Source
When it comes to planning a market strategy, our most important graph is “Leads by Source” (below). It shows us which sources are responsible for the leads most likely to go to construction (family and friends), and which ones produce a lot of leads that don’t result in construction contracts (architects).
![]()
![]()
This particular graph confirms that we should continue encouraging referrals from family and friends, and that time spent following up these leads is well spent. At first glance, we also may be inclined to concentrate less on architect leads, since so few go to construction. However, if we look at the details we see that a high percentage of leads from architects are classified as potential clients. This means architects are a good source of leads, and the fact that we’re not getting those jobs indicates there may be a problem with our sales approach.
Worthwhile effort. Once the lead-tracking spreadsheet has been set up, generating the graphs doesn’t take much time. Capture the right information and you’ll be more effective in making your leads contribute to the success of your business.
Amy Cracco manages the office for Modern Yankee Builders, a residential remodeling company in Cumberland, R.I.