Download PDF version (94.7k) Log In or Register to view the full article as a PDF document.

In January 2004, I left a good marketing job with a major electronics manufacturer to start a remodeling company in San Jose, Calif. When we opened our doors in January 2005, I had three employees. Four years later, we’ve grown to 19 employees and are doing $3 million in business — everything from two-hour handyman jobs to large remodels that last several weeks and sell for more than $100,000.

I credit much of the growth to our staff, who do high-quality work and take great care of customers. It also helped that, as part of the Case Remodeling franchise, we hit the ground running, with proven systems for sales, operations, production, and customer service.

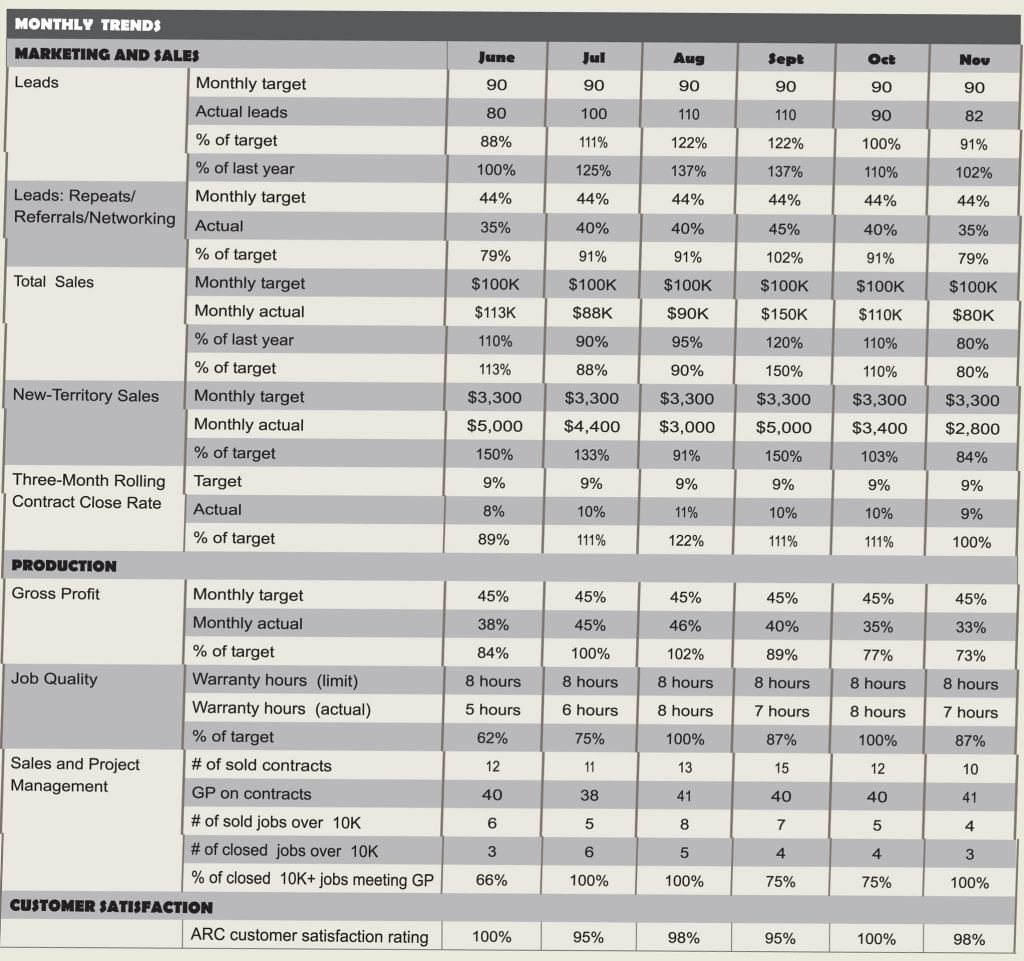
But even companies with good systems can get into trouble if they don’t manage their growth. To avoid that fate, I created a “dashboard” — a set of fundamental numbers that shows me the monthly trends in our sales and production pipeline: leads, close rates, job profits, and customer satisfaction.

I pull reports from a couple of sources — QuickBooks, for example, and our in-house customer-management program. But it doesn’t matter what software you use or even if you log in the information by hand. The point is to track your numbers — I look at them a few times each week — and record them on the dashboard (see spreadsheet). The monthly totals show me where the business is going and where we need to adjust. Because I keep a close eye on these trends, I seldom have to make reactive decisions under stress. And in the long run, I make better decisions for my company.

Image

This spreadsheet shows a sample dashboard for a hypothetical company projecting around $100,000 per month in business. It covers a six-month period and includes all of the categories the author uses.

The items we include vary slightly from year to year; some of them — leads, for example — are raw numbers, while others are percentages or dollar figures. In this article, I’ll go through the items one by one, explaining why I track them and how I use the information in my business decisions.

Marketing and Sales

This section of the dashboard tells me how successful we are at converting different types of leads, and whether we need to refocus our lead-generating efforts.

Total leads. This is a tally of how many leads we are getting from all sources: repeat customers, referrals, direct mail, print advertising, the Internet, and so on. At the beginning of each year, we set monthly lead targets. The dashboard tells me if we’re meeting them and how we’re doing compared with the same month last year. If the dashboard shows that we’re missing a target, I meet with the sales staff to figure out why.

Repeat/referral/networking leads. Repeats and referrals made up 33 percent of our leads last year. We decided we wanted to grow that number to 44 percent this year, so we started attending more networking meetings and stepped up our marketing to past clients. The effort has paid off: By late summer we were getting 45 percent of our leads from repeat customers and referrals. Although the number of leads has dropped since the bad economic news in September, the percentage of leads we’re getting from repeats and referrals hasn’t changed much.

Total sales. This is a dollar figure that tells me whether we’re hitting our monthly sales targets and how we’re doing compared with the same month a year ago. If we’re not hitting our targets, my salespeople and I revisit all leads that didn’t close. Sometimes it’s just a bad economy, while other times we might find that a salesperson is in a slump. The worst case is that we determine that a salesperson is in the wrong job. (We’ve let four salespeople go in four years.)

Other times we find that a lead source has lost its effectiveness. In the past, for instance, we received leads from matching services like ServiceMagic — as well from the Yellow Pages — but since most of those prospects were price shoppers, we decided to switch our focus to sources that bring higher-quality leads. That’s why we now put more attention on referrals and networking.

New-territory sales. Each year we try to expand into a new city or town that fits our target demographics. The dashboard tracks the dollar volume of business we are doing in that area.

Currently we’re trying to expand our business in Los Altos, and we were on target before the bad economic news in September. That tells us that our efforts have been paying off, so we will continue those efforts regardless of the economic news.

We’re not always that successful. Last year’s target was Saratoga. It’s a promising market with lots of home equity, but halfway through the year the dashboard alerted me that sales weren’t what we had hoped for. When we looked deeper we found that Saratoga had a lot of “older” money. In many cases, homes are valued in the million-dollar range but were bought decades ago for $30,000, and the owners are reluctant to spend, say, $60,000 on a new kitchen. So we decided to narrow our marketing in this city to people who recently purchased. As a result, we’ve seen an increase in sales in that area.

Three-month rolling contract close rate. This is a percentage that measures our sales team’s effectiveness. (I look at a three-month period because our more complex jobs can take three months for the salesperson to close.) We target a close rate of 30 percent for remodeling leads and 85 percent for handyman leads. We measure our progress according to its variation from the actual target.

A low number can be a sign of other resource issues. At one point, for example, we discovered that one of our sales consultants had been getting drawn into the design aspects of bigger projects, leaving him less time to take new leads — which dried up his sales pipeline. I decided to hire an associate project designer to work with clients on drawings and selections so that our salespeople could keep their pipelines full.

Production

The production numbers gauge our efficiency and effectiveness on the job, and include profit and quality.

Gross company profit. This is the gross profit percentage for the entire company. We aim for a GP of 45 percent; how close we are to that is a good sign of our estimating accuracy and our production efficiency. If we fall short, we examine all of our projects. The problem could be a one-time glitch, like a framing error that required extra materials to fix. Or it could be that one crew lacks a certain skill set.

In one case, the problem was a good carpenter whose jobs were dragging on longer than necessary. When we met with him, he admitted that while he started jobs with lots of energy, he eventually got tired of the long duration. We switched him to small time-and-materials jobs, and he has excelled. He loves being able to start and finish a job in one day. As a bonus, he has an outgoing personality and is great at building rapport with clients, making him a terrific ambassador for our company.

Job quality. This section compares the hours we spend on warranty work with the monthly limit we’ve set — eight hours at our current work volume.

If warranty hours exceed the limit, we investigate. Maybe some of our guys need training in a particular area. Or maybe there’s a problem with one of our subcontractors. The numbers tell us when we need to devote time at our weekly production meetings to identifying and solving those problems.

Sales and project management. Here, I look at how many contract jobs we’ve sold and the associated gross profits on those jobs. (The reason these numbers are in the production section of the dashboard is that they’re driven by our salespeople and our production team working together.)

I also track closed and sold jobs priced over $10,000 and the percentage of those jobs that are meeting our gross profit targets. I do that because large jobs generate the greatest share of our revenue and have the biggest impact on our profits. Next year I plan to change that number to $20,000, as our average job size has increased. Even if business is slower than projected, I’m predicting that the average job size won’t change much, and therefore plan to stick with the new number.

Customer Satisfaction

Because we depend on referrals and repeat customers, we use a rating system to gauge customer satisfaction.

Every six months, American Ratings Corp. surveys our clients. A 90 percent satisfaction rating earns us a “diamond” certification rating — and since we get lots of quality leads from this program we do everything possible to keep that rating. If clients report problems, I ask the rating company if I can talk with the clients who complained so that we can quickly identify and correct the issues.

Other Numbers

I also have a separate dashboard on the local economy that includes property values, materials costs, construction employment, and general employment. These numbers help me make projections. For instance, falling home prices will reduce the equity people have in their homes, leading me to revise my sales forecasts.

I anticipate changing market conditions by making three forecasts each year: the one we expect to follow, a more optimistic one for a better-than-expected market, and a pessimistic one in the event the economy goes south. The third scenario cuts expenses in a way that doesn’t undermine our ability to be successful in the future. Unlike some builders, I don’t cut back on marketing in a slow economy, which I believe is one reason we’re doing well in this market.

Jim Kabel owns Case Handyman and Remodeling of San Jose, Calif.