Confusing why? First of all, the wind speed maps are going to change — again. Last time that happened was with the 1998 edition (yes, they revised it on a different schedule back then). In 1998, ASCE 7 switched from the “fastest-mile” wind speed to the “three-second gust” wind speed, and overnight, the map of wind zones that tells engineers what design wind speed to use for a given location was redrawn. All the old design manuals based on the fastest-mile speed suddenly became outdated, and codes and design handbooks had to start including conversion tables for wind speeds. For instance, a 90 mph (3 second gust) wind speed corresponds to 75 mph (fastest mile) — et cetera, et cetera.
The end result, however — the specific details required in a building — did not necessarily change. That’s because the formulas used to translate wind speeds into design loads on a structure were also adjusted at the same time. So when it came to practical engineering, the more things changed, the more they stayed the same. Even so, for many builders, and for code officials too, the new wind speed maps were a big source of confusion. Many coastal states were introducing statewide codes for the first time, and for some builders, consulting any wind speed map at all was a new thing. Having more than one version of the map floating around only made things worse.
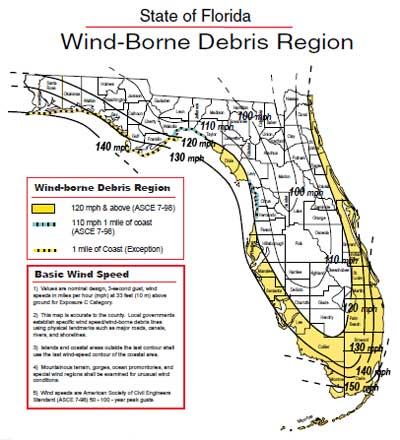
Wind speed and windborne debrismap for Florida, effective as of 2001. Don’t get too comfortable with it, though — within a few years, it will be changing. To view the full size original image, click here. Well, get ready: the map’s going to change again. In ASCE 7-10, the official wind speeds on the map will be even higher than before — at least on paper. Says engineer Jay Crandell of Ares Consulting, who sits on the ASCE 7 committee, “Where the map says 120 mph currently, it will now say 150 mph.” But that’s just the number on the map. As before, the increase in the official wind speed will not necessarily require stronger building details in the field. In fact, for many locations, the actual building requirements will be slightly reduced. Says wind engineering researcher Peter Vickery of Applied Research Associates, who conducted the computer modeling for creating the maps, “Effectively, the numbers are coming down.” Higher wind speeds, lower engineering numbers; what’s going on?
New Map, New Method
It turns out — and this is the confusing part — that two things are really happening to the wind speed maps at once. On the one hand, the wind speeds will be bumped up simply to incorporate an adjustment called a “load factor” that engineers currently include as a separate step. The way things work now, says Vickery, “if you do a load and resistance factor design, when you go through and do your wind loading calculations, at the end, you multiply the wind loads you calculate by a load factor of 1.6, then you go off and you do your resistance factor calculations and you’re done.” Under the new method, the designer starts with a higher wind speed number. “Then you go through, and the calculations are the same, except instead of multiplying by 1.6, you multiply by one,” explains Vickery. “So basically, that load factor effect is put into the wind speed map…Ideally, if you had the identical set of models to develop the wind speeds that are on the map, you would get exactly the same answer using the new method as you had using the old method.”
But there’s another change happening at the same time: the wind speed models, and the design speeds they generate, are also changing. There’s new wind speed information available, and the scientists at Applied Research have put that new information into new prediction models for hurricane wind probabilities. New Model, New Numbers
Vickery’s simulation model for future storms is based on data taken from measurements of past storm behavior, including wind speeds, pressures, and storm tracks. “We run thousands and thousands of years of hurricanes, based on our 120 years of records — just different realizations of what could have happened in the last 100 years. So we have simulated hurricanes making landfall everywhere in the U.S., and for every simulated storm we have, we keep track of the windspeeds. And at the end of the day, it’s like having 100,000 years’ worth of wind speed records for all the sites. Then you back out what the 100-year wind, or the 50-year wind, or the 1,000-year wind is going to be at any location.” In the new wind speed map, the lines represent a 700-year storm — the hurricane that might hit any given area, on average, once in 700 years. Vickery and his associates developed the hurricane model for ASCE 7-98 based on aircraft wind speed measurements. Now, they have ten more years of careful aircraft measurements to draw on — plus information from parachute-borne “ dropsonde” instruments that didn’t even exist in 1998. So their latest model is more complete and more accurate about the relationship between storm eyewall winds and eye pressures, and about the expected winds farther from the storm center. It turns out that wind speeds farther from a given storm’s core actually tend to be lower than the previous model had assumed. So the likelihood of destruction at various parts of the shoreline is now predicted to be less than in past models. That result will show up in the new wind maps. As Jay Crandell puts it, “the lines will all be pushed seaward.” The Return of Exposure D
But there’s one big exception to this general reduction in wind loads: the strip of land right on the beach, within perhaps 600 or 1,000 feet of the shore. Applied Research’s new data and modeling have overturned another assumption about storms: the idea that high waves stirred up by the hurricane slow the wind speed and reduce the wind hazard to buildings. Besides wind speeds, ASCE 7 has “exposure categories” that reflect the way obstacles, such as rough terrain, protect buildings from the force of storm winds. In recent versions, the shoreline “Exposure D” category was taken away, in order to reflect the supposed damping effect of high waves. But the newest data indicate that for very strong storms, the waves don’t really slow the wind much. Scientists aren’t sure why, but one theory is that the highest winds turn the water surface into a low-friction “froth.” Whatever the reason, the new finding means Exposure D is back — which means that for houses right on the beach, the requirements won’t change. Windborne Debris
But the changing wind speed numbers will have some effect on some locations near the beach — because they effect the “triggers” for windborne debris requirements. Under ASCE 7-10, the parts of the coastline where buildings need impact-resistant glazing or storm shutters will shrink. Besides a few barrier islands right along the shore, almost no place north of the southern tip of Florida will have to have impact glazing — a relief for many builders, which some are sure to take as vindication for their resistant attitude toward the impact-glazing requirement in the first place. ASCE 7-10 is not quite a done deal yet. A few more discussions and votes still have to take place. But soon enough, the process will wrap up, and the new standard will come out in print. Then starts the process of adopting the latest update into the model building codes, and finally the adoption of those codes at the state and local level. That leaves plenty of time for builders to get familiar with the implications of the changes in the world of design and construction. We’ll take a closer look at the changing standard, and at other information coming out of Applied Research’s modeling, later in the year.