

I've recently become a fan of the Ecobee thermostat. While other "smart" thermostats on the market, such as Nest's, offer online control and home monitoring features, the Ecobee is the only thermostat I know of that provides extensive data logging and has a simple, free Internet portal for tracking performance. The Ecobee records and logs indoor and outdoor temperatures, set point, indoor humidity, and equipment runtime. It's a remarkable tool for diagnosing and solving the kinds of comfort problems that prove to be the most mystifying for those of us working to improve home performance: a room that won't heat or cool; a house that isn't "comfy"; indoor allergies or dry skin; a "clammy" area; and the like. Haven't you wished that you had some insight into the causes of these complaints? I sure have.
Of course, you could drop an IAQ monitor, such as Air Advice, at the home, or a Hobo data logger (see "Monitoring Home Performance," Sep/14). But what happens if you retrieve the logger too early, before a house experiences the particular conditions causing the problem you're trying to solve? Chances are either you will remain mystified or you will have to make additional trips (likely unpaid) to drop off and pick up the data logger again. The Ecobee offers a permanent option.
Ecobees can control a wide range of equipment. The better models can manage several pieces, such as a humidifier, an HRV/ERV/ventilating dehumidifier, or hybrid furnace/heat pump setups. They can also tell multi-stage equipment to "reverse stage." Many thermostats start in high stage, satisfying the thermostat too quickly, which leads to comfort and humidity problems. With the Ecobee, the staging can be changed to start in low rather than in high, depending on temperature swing from set point. Ecobees can also cycle the fan a few times an hour to mix indoor air or provide a number of other tweaks that might improve energy performance or solve a client concern.
Those features aren't the primary focus of this article, however. Comfort issues are my immediate concern, partly because they can be so difficult to solve. But solving for comfort usually fixes root problems, and energy efficiency tags along like a loyal puppy.
The Complexity of Human Comfort
The more I learn about building science, the more complex I realize human comfort is. It is not only air temperature that affects comfort. Surface temperatures, humidity, rate of change in temperature, air velocity, odor, noise, and many other factors also contribute to how comfortable a person feels. It can be tricky to discover causes behind complaints based only on what clients tell you.
The Ecobee can provide key information relating to comfort, including the time it takes the temperature in the house to change during and between system cycles or when clients change the temperature set point; the frequency of equipment cycling; the length of runtimes over a day, week, or month; and the fluctuations in humidity levels.

A Building Science Nerd's Dream
My friend Cameron Taylor owns an Ecobee and had this to say about his experience with the data logging abilities of his "Smart" model: "My house, located in Fort Worth, Texas, is a 55-year-old, 1,800-square-feet single-story ranch on slab equipped with white reflective roofing and sealed attic bypasses. The screenshot on the following page shows Ecobee data for this home on May 21, 2014. The weather that day—though not typical of a hot, muggy Texas summer—is representative of summer in many other areas of the U.S.
"Note the eight-hour period highlighted by the red box I added. The green line indicates indoor air temperature, the black line is outdoor air temperature, and across the bottom is equipment runtime. Indoor temperature rose only 3 degrees over eight hours, indicating that improvements to the home's thermal and pressure boundaries were effective at reducing heat gain under these conditions. Note also that the A/C did not run at all (indicated by vertical blue lines at bottom of graph) during this period. With the thermostat doubling as a data logger, I can see this degree of granular data for my home's thermal performance. The Ecobee Web portal also allows me to export the recorded data in Excel format. It is a building science nerd's dream!"
Monitoring Comfort
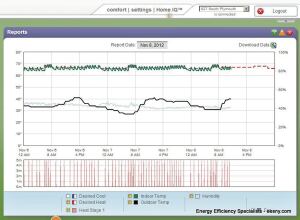
Take a look at the second graph, which shows data from a two-and-a-half-story rental house built in 1880 in Climate Zone 5. See how the temperature (green line) races up whenever the furnace runs? Fast temperature changes can feel uncomfortable; our bodies prefer slow changes. It's possible that this home's furnace is oversized, the occupants are uncomfortable, and the energy bills are high. Once you start installing Ecobees, you'll realize that almost all HVAC equipment is substantially oversized, which very often leads to comfort and balance problems.
Indoor air temperature. Many of us have lived in older homes that were poorly insulated. In those homes we had to sit on or near a heat vent to keep warm. More than likely, the indoor air temperature fell like a stone when the furnace shut off, and the surrounding surface temperatures never quite warmed up to levels needed for human comfort. Maintaining consistent air and surface temperatures—achieved with right-sized HVAC and a decent (it doesn't have to be perfect) building enclosure—are critical to maintaining indoor comfort.
Look at the graph again. See how quickly the temperature drops once the furnace cycles off? This suggests that the home may need air sealing and insulation. Wouldn't this data enable you to ask the client informed comfort questions as well as guide your investigation efforts?
When clients are cold, they increase the temperature set point. If you see thermostat games—the red dashed line on the graph tells you that—you know that there are problems.
Indoor humidity. Moisture levels play an important role in comfort. During the cooling season, if humidity is too high our sweat can't evaporate quickly enough to cool us effectively. We roast and get wet. An oversized air conditioner won't run long enough to pull humidity levels down, so clients may drop set points to uncomfortably cool temperatures in an attempt to reduce humidity. My wife doesn't like A/C because of this, and I know she's not alone.
During the heating season, if humidity levels in the home are too low, moisture evaporates too quickly. We feel cold and our skin, sinuses, lips, hands, ankles, and feet may dry out. A whole-house humidifier is often the fix here, but be careful! If the house leaks air into the attic, that solution will cause mold and moisture problems in the attic. And if the humidifier control isn't managed to decrease humidity levels in very cold weather, moisture problems could occur on windows, walls, and ceilings. Smart-line Ecobees are capable of controlling humidifiers and can be tied to outdoor temperature so that they automatically manage humidity.
The "happy place" for relative humidity is between 30% and 55% (see chart, above). There isn't much chance for mold on the high side, nor much chance of flu spreading on the low side (that is a factor), and our skin doesn't dry out. Without a data logger of some sort, how would you figure this out?

In addition to recording fluctuations of indoor temperature and humidity without your making multiple trips to the home, the Ecobee can check weather data, look for the coldest or hottest day, and display what happened under these conditions in the home. No other thermostat performs data logging to the extent an Ecobee does in order to help with problem diagnosis.
You may know the basic solutions: Tighten the home, insulate it better, and right-size the HVAC. But insight is powerful. It can help to sharply focus your efforts. What that looks like varies by client, home, and budget. Until you know the details of comfort problems and do a thorough energy audit, you can't tailor a plan to fix those issues. But an Ecobee could be an important tool in your toolbox to help with initial and ongoing diagnosis.
Nate Adams runsEnergy Smart Home Performance, based in Cleveland. Cameron M. Taylor is adjunct instructor of HVAC at Tarrant County College, Fort Worth, Texas, and educational director for Region 10 of the Refrigeration Service Engineers Society.


